Will Smith – Director of Software
What is Chatter and its Sources
Chatter is a repeating pattern of small peaks or ‘undulations’ that occurs at regular intervals and can appear on the finished surface of a machined piece. Chatter is not form error (roundness and lobing), and chatter is not surface finish (roughness); rather, it exists between these two regimes. In critical components, like a rotating shaft within an engine or motor, chatter can cause issues within the final assembly that could lead to premature part failure and damage other components. This article will explore the reasons for chatter in shaft components, evaluation methods, and output of measurements to improve shaft quality in high-demand assemblies.
Chatter, a major source of noise, vibration, and harshness (NVH) in engines, can be found with proper quality processes and equipment. Chatter can be generated in any machining operation like milling, turning, boring, grinding, etc. More specifically, chatter is usually caused by tool imbalances, lack of tooling or fixturing stiffness, non-isotropic part stiffness – a particular issue with crankshafts, out-of-round part centers, malfunctioning or worn equipment, and other sources of imbalance or vibration.
Why is Chatter Inspection Important
Modern motors and internal combustion engines (ICE) demand tighter tolerances and higher performance, making efficiency and longevity crucial. Rotating shafts with chatter patterns can cause excessive noise and vibration issues within the final assembly of an engine or motor, potentially leading to NVH concerns that could require recalls, which can lead to customer dissatisfaction, reputational damage, and loss of sales. This is particularly true in high RPM requirements such as EV rotor shafts, which can reach 20,000 RPM or more. Chatter is a feature that has been measured and analyized by manufacturers have been measuring and analyzing for decades, but it can also be overlooked when designing a new part. Whether for engines or motors, this parameter can be critical to monitor. While production machines are often prioritized in budgets, quality control equipment is equally important. Poor quality can be costly, so engineers and production managers must develop robust quality control systems and ensure they have the right equipment to measure necessary features.
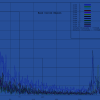
Chatter often occurs at a specific frequency related to the proportion of the grinding wheel or cutting tool rotation speed and the workpiece rotation speed. The resulting ‘natural frequency’ of the process will show a consistent signature, often having higher harmonics present in the frequency domain plot. Process parameters are adjusted to control the amplitude at this ‘natural frequency’ and/or shift the frequency at which it occurs to suit the product requirements. Increases in the amplitude value at this frequency and/or additional amplitude spikes/peaks at other frequencies often indicate a process related issue or external influences. External influences may include nearby motors, pumps, other equipment (such as stamping or pressing machines) or forklift traffic. The chatter output can help guide technicians and engineers to the source of the issue, leading to correction and restoration of product quality.
How to Inspect for Chatter
Equipment
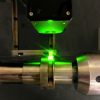
Quality control machines are optimized to measure a specific set of parameters; for example, a precision tactile machine can often measure chatter, while an optical machine cannot (or not as effectively). Chatter is not something that would be detected by evaluating standard GD&T features like roundness or refinements of roundness data such as sector roundness or lobing. The amplitude can be quite small at sub-micron levels, the chatter may be limited to a single area, and the frequency of the chatter may vary significantly. However, regardless of the amplitude, region, or frequency variations, chatter can still have a discernible impact on the quality, final assembly, and performance of ICE or electric motors.
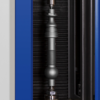
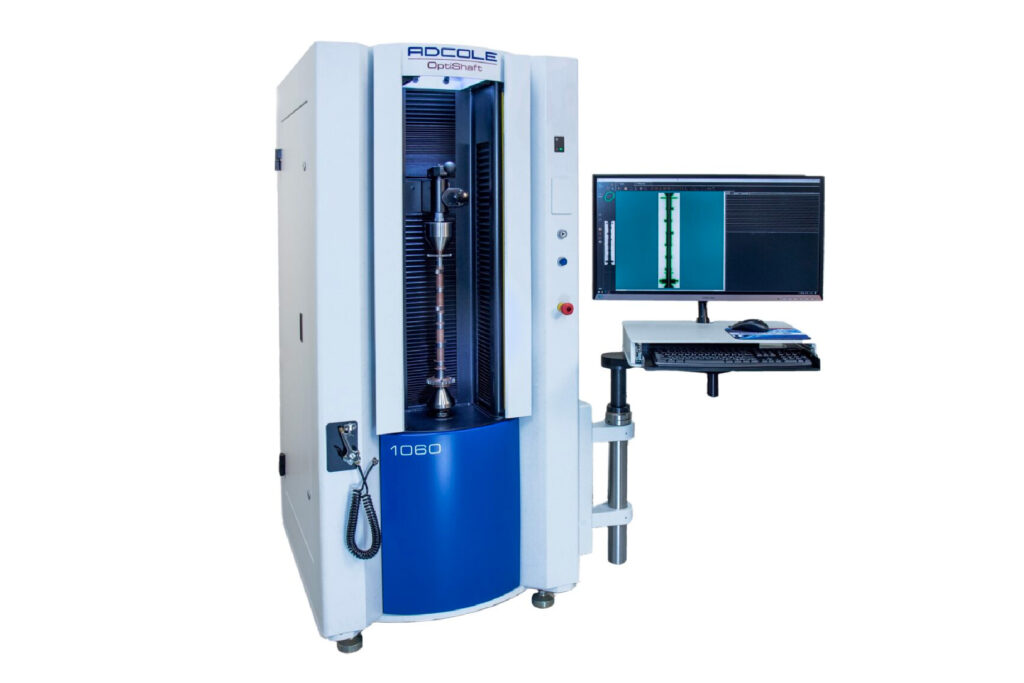
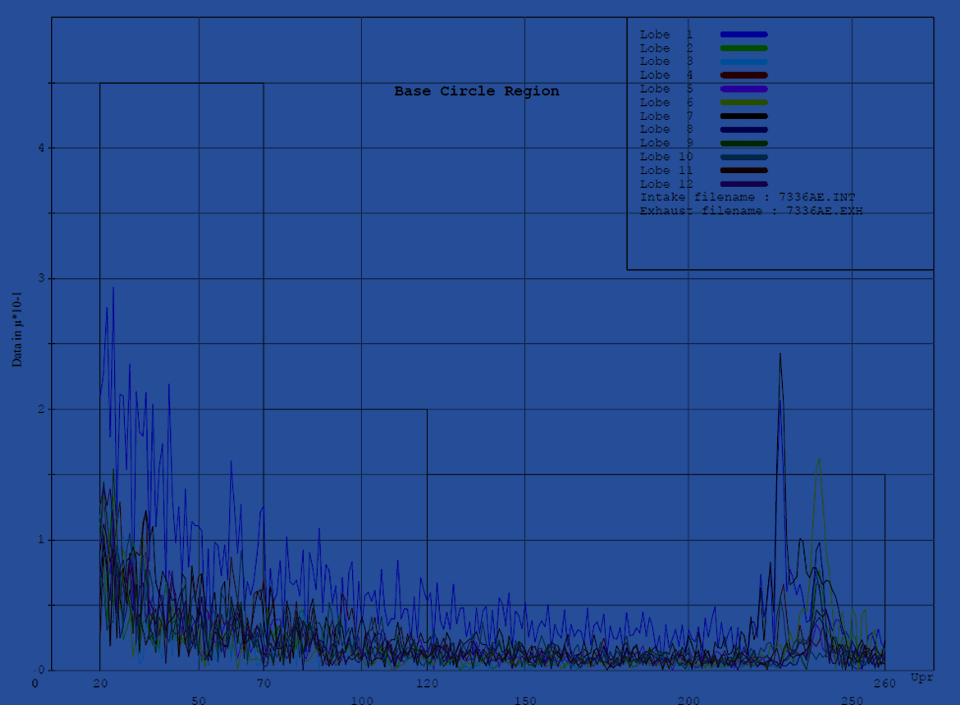
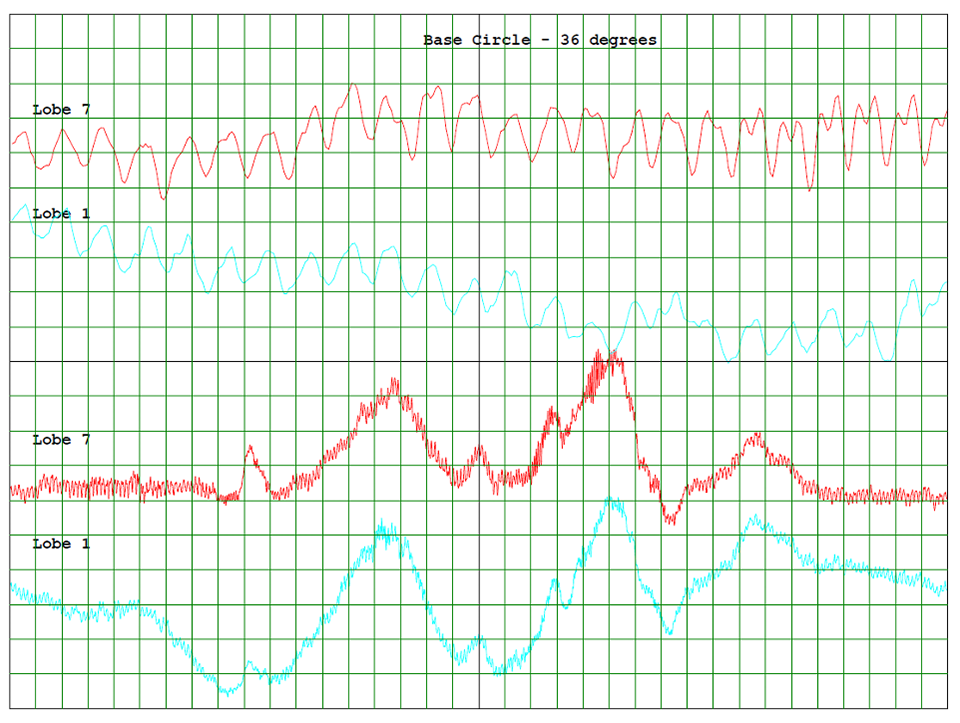
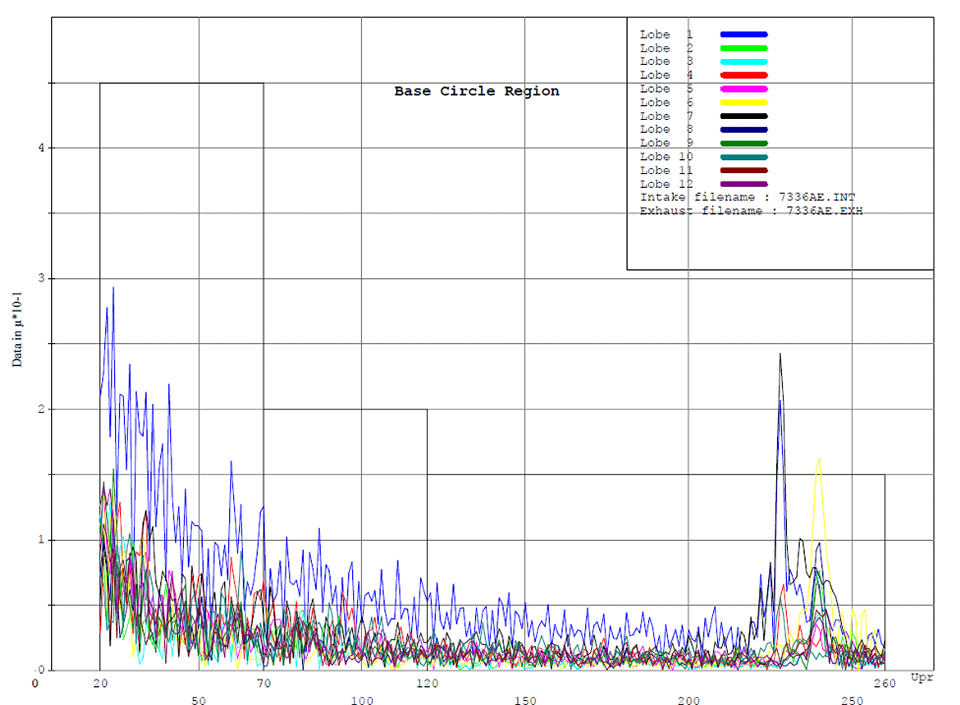
One tool for measuring chatter on shafts after a grinding process would be an Adcole tactile shaft metrology gage. These gages, along with proper software that can measure a wide range of GD&T parameters, provide valuable data and analysis to maintain the demanding quality required for rotating shafts. In the camshaft world, analysis of a lobe base circle region where the grinder velocity would be uniform over a constant radius provides a cleaner signal for detecting a chatter issue. The lift region of the lobe where radii rapidly changes could be analyzed separately, providing additional information over the surface that would have been ground with an adjustable velocity.
Evaluation Methods
“And because many vibration-related issues occur at specific frequencies, the cause and location of the vibration can be narrowed down or identified based on variations in amplitude at certain frequencies.” (Collins, 2022). This is why calculating amplitude over a frequency domain is better than simply counting lobes or peaks within the profile error.
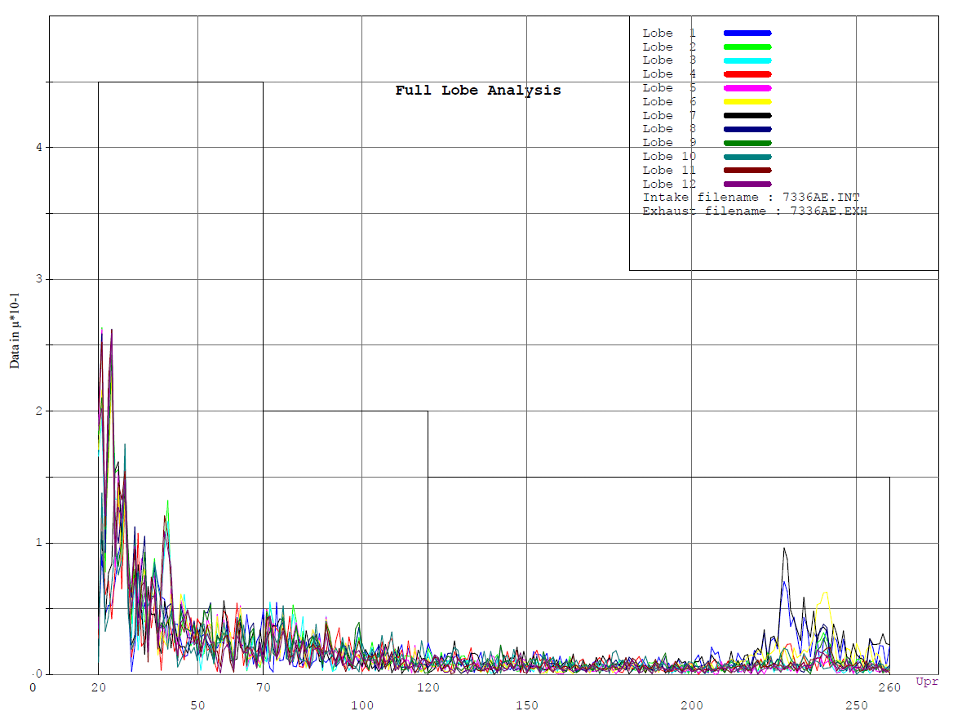
All measurement data goes directly into data collection software, which records the signal as either amplitude vs. time which is known as time waveform, or amplitude vs. frequency which is known as fast Fourier transform (FFT), or both. All this data is analyzed by computer program algorithms, which in turn is analyzed by engineers or trained vibration analysts to determine the health of the machine and identify possible impending problems like looseness, unbalance, misalignment, lubrication issues, and more. Vibration analysis can detect problems such as wheel imbalance or wheel dressing issues.
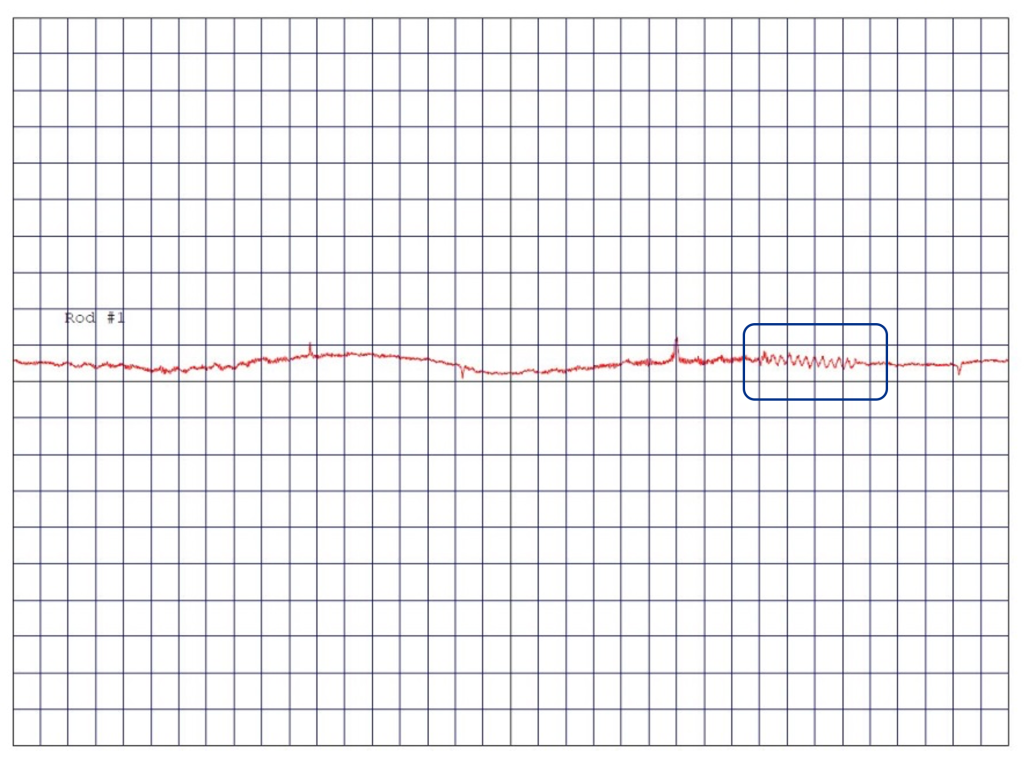
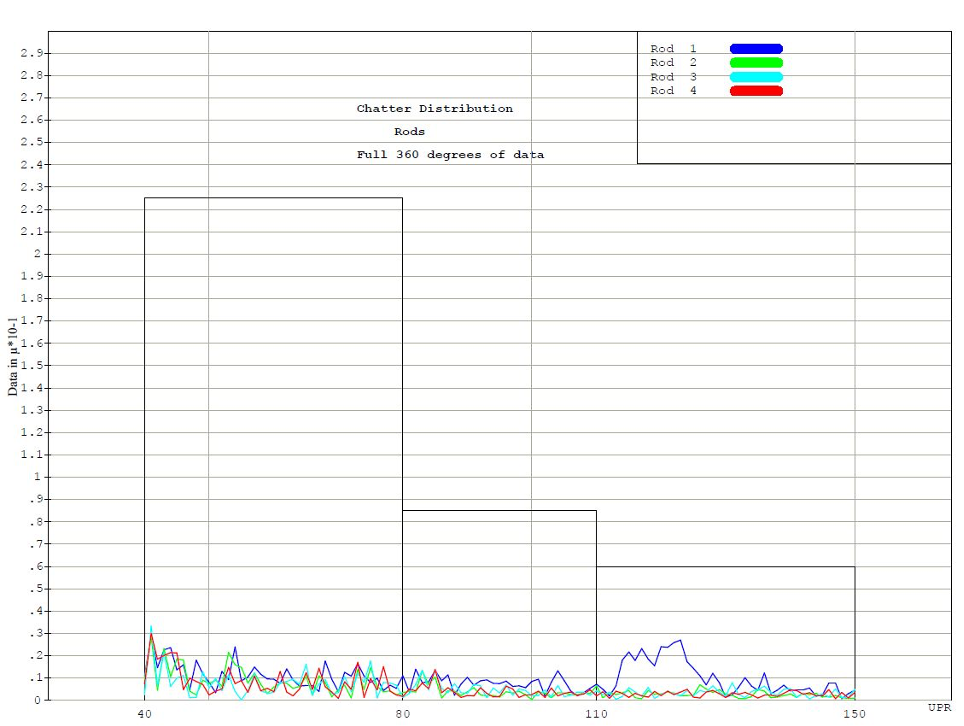
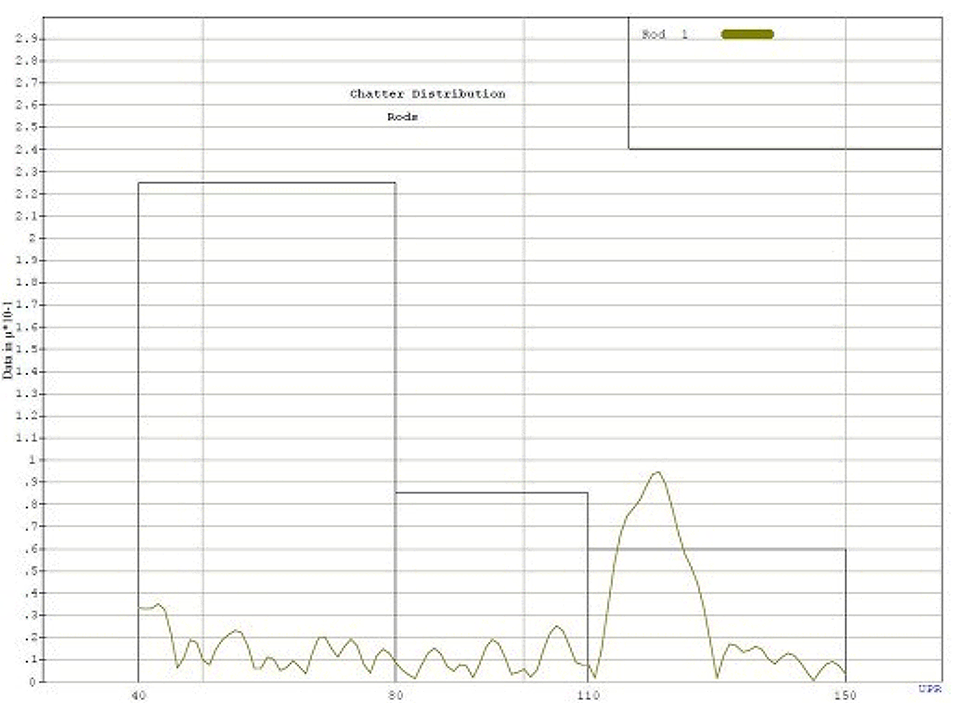
Chatter can also mask itself on a shaft journal by showing up only over a small angular range. This makes it more difficult to measure and detect. Another method is the quadrant analysis option that can be used for journals on any rotating shaft. This allows for the entire 360 degrees of roundness data to be analyzed for chatter, and it breaks the roundness error into four 90-degree regions for chatter analysis. This analysis option provides a tool that can pick up a “chatter burst” on the surface of a journal where during the production process a region of usually less than 90 degrees exhibits a pattern of undulations. The amplitude of these undulations is frequently too small to affect the roundness or even lobing measurement parameters but can still cause issues with NVH in the final assembly of the engine. By analyzing the roundness error over 90 degrees, it is possible to measure a higher amplitude of chatter that may exceed the defined tolerance.
One method for finding chatter over a limited angular range is to use a “sliding window” method. This allows for setting the angular window in degrees and the slide degrees increment. This sliding window will go through the full 360 degrees of roundness or profile error data and determine the maximum amplitude and the angular region where this occurred. It is also important that the necessary tests allow for the development of a chatter tolerance and a range of chatter to be analyzed over a specified angular region. This can be based on running a series of tests on known “noisy” shafts and comparing that to the same series of tests on known “quiet” shafts.
Output of Chatter Measurements
Chatter can appear on part surfaces in different ways. Sometimes it can show up over a large angular window and have a clean frequency. This can potentially be seen in a roundness or profile error plot of the specific element being measured. However, chatter can also be masked in a roundness or profile error plot since these often apply a filter to the error data that can hide the chatter.
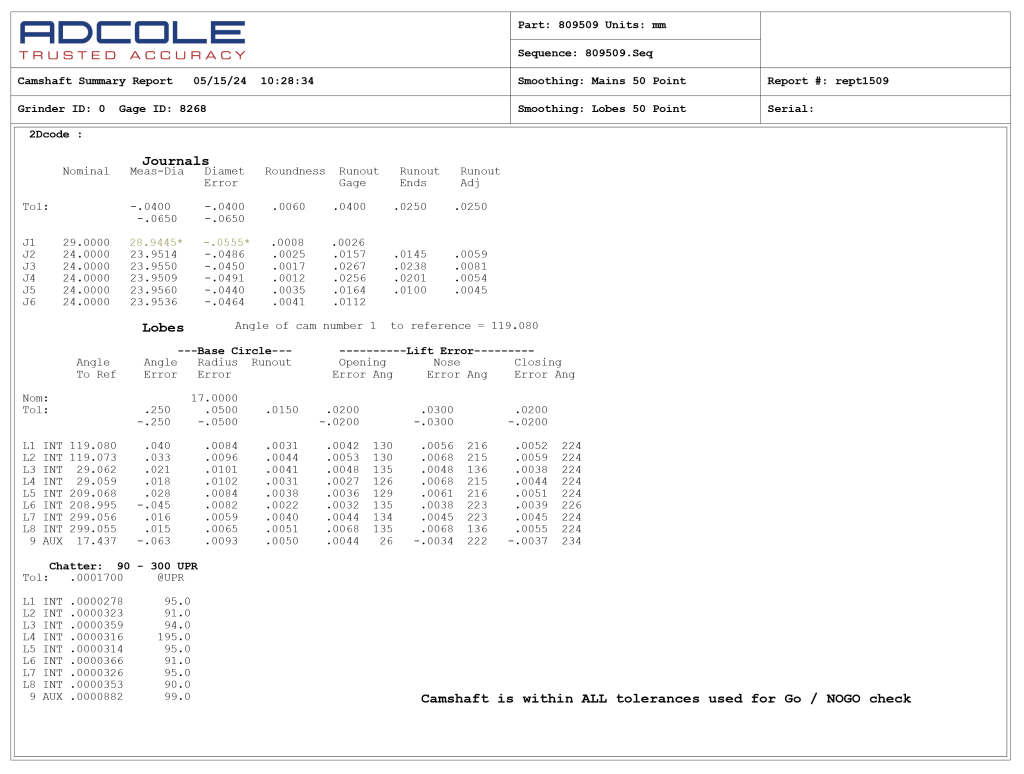
In Figure 2a, there is an error plot of journal roundness and camshaft lobe profile error, with the six lobes at the bottom of the plot. These lobe profile plots show the base circle region between 0–90 degrees and 270–360 degrees. The lift region error is from 90–270 degrees. In this example, you can see a clear pattern of undulations in the base circle region. Since the base circle has a constant radius, it is normally ground at a constant velocity – this is not true for the lift region.
Some companies use a lobe counting process to determine issues in the manufacturing process. This has value in determining angular regions in the roundness or profile error that exhibit non-conformity, but it has weaknesses as it relies on an internal definition of how a lobe or peak is defined so that it can be counted. This normally does not look for equi-spacing between peaks, thereby not being able to determine a specific frequency of occurrence.
Conclusion
Measuring chatter is critical to consistently producing quality shafts that will function for long periods without leading to noise and vibration, which can cause faster part wear or failure. A precision rotary part with measurable chatter, rotating at high speeds, could lead to a complete engine or system failure. Having tools with advanced analysis options that can look at surface chatter over defined regions can detect a problem in manufacturing before the product gets out the door. Shaft manufacturers should plan on investing in the proper quality tools or gages for in-line or audit room settings to analyze potential errors in manufacturing outside of the specified tolerances and take action to correct them.
Collins, D. (2022, October 17). How are fast Fourier transforms used in vibration analysis. Motion Control Tips. https://www.motioncontroltips.com/how-are-fast-fourier-transforms-used-in-vibration-analysis/